Average Directional Index in Crypto Explained
by LCX Team ·
In the world of crypto trading, the Average Directional Index (ADX) is a popular technical indicator used by traders to determine the strength of a trend in the price of a cryptocurrency. Using price moving averages, ADX gauges the strength of a market trend and is represented by numbers between 1 and 100.
What is the ADX indicator?
The ADX indicator is a technical indicator that is used to measure the strength of a trend. Its foundation is the notion that trading when the market is moving in the direction of a strong trend increases the likelihood of profit and significantly reduces the risk. The ADX indicator was developed by Welles Wilder for daily commodity charts, but technical traders and financial analysts now use it in a variety of markets to gauge the strength of trends.
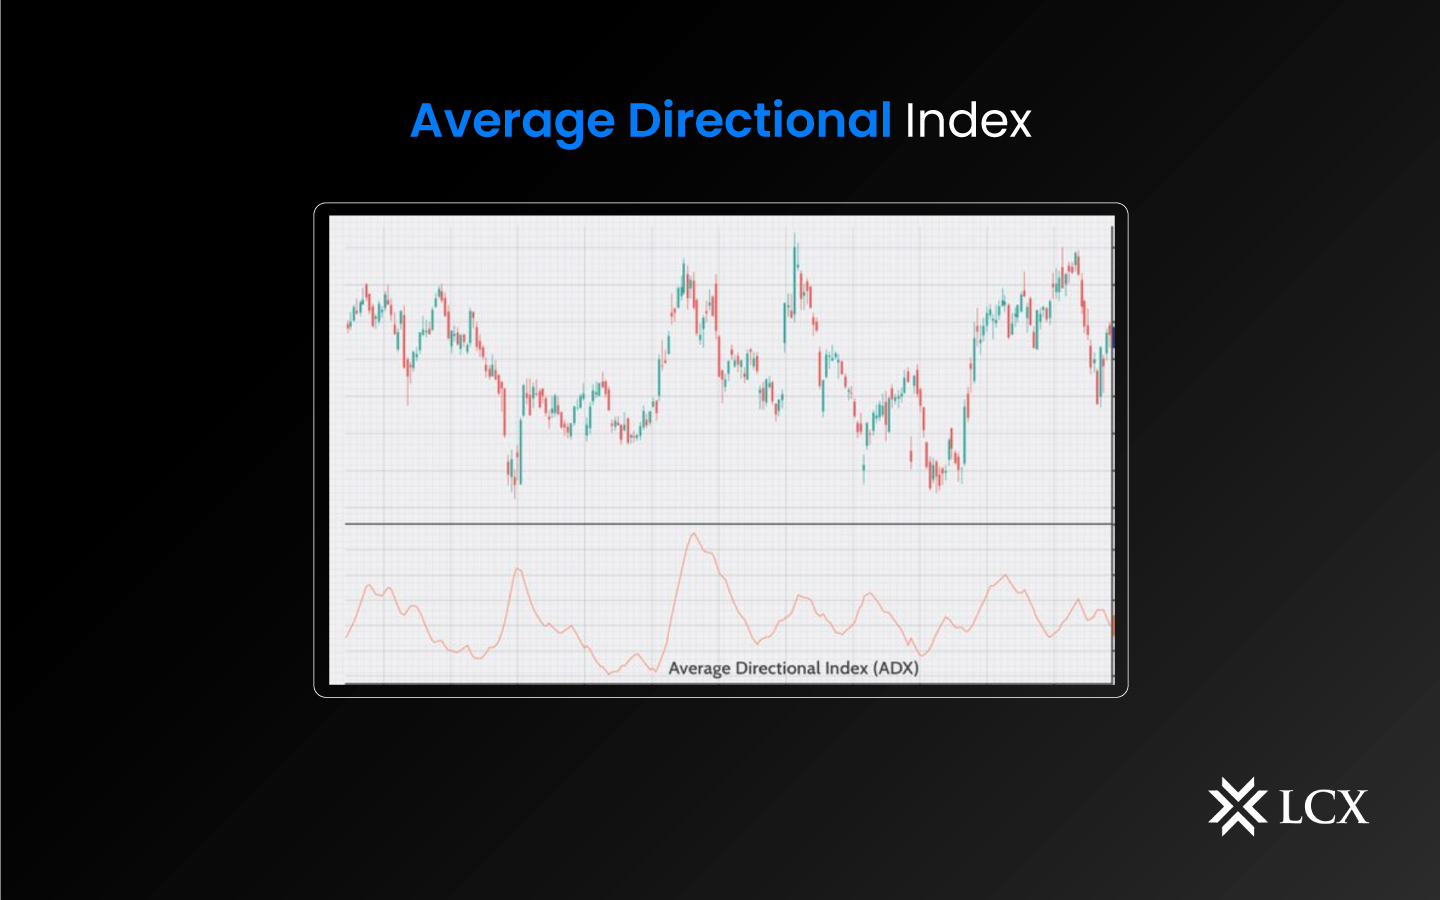
The Average Directional Movement Index (ADX) is a non-directional indicator that gauges trend strength regardless of whether prices are rising or falling. It is based on a moving average of the difference between two other indicators: the Plus Directional Indicator (+DI) and the Minus Directional Indicator (-DI). These indicators are calculated using the high, low, and close prices of a particular cryptocurrency. The ADX is calculated using a 14- day period, and the line is plotted on a scale of 0 to 100, with higher values indicating a more robust trend and lower values indicating a weaker trend.
The ADX indicator is typically used in combination with the +DI and -DI lines to determine the strength of a trend. When the ADX line is above 25, it is considered a strong trend. When the ADX line is below 25, it is considered a weak trend. When the +DI line is above the -DI line, it indicates that the trend is bullish. When the -DI line is above the +DI line, it suggests that the trend is bearish. If the +DI and -DI lines are close together, it indicates that the trend is indecisive.
In Conclusion
The ADX indicator is a popular technical indicator that can be used to gauge the strength of a trend in the price of a cryptocurrency. By interpreting the ADX line in combination with the +DI and -DI lines, traders can make better trading decisions in the crypto market. It’s important to remember that the ADX indicator should be used in conjunction with other technical indicators and fundamental analysis, as no single indicator can provide a complete picture of the market.