Balance OF Power Indicator Explained
by LCX Team · September 12, 2023
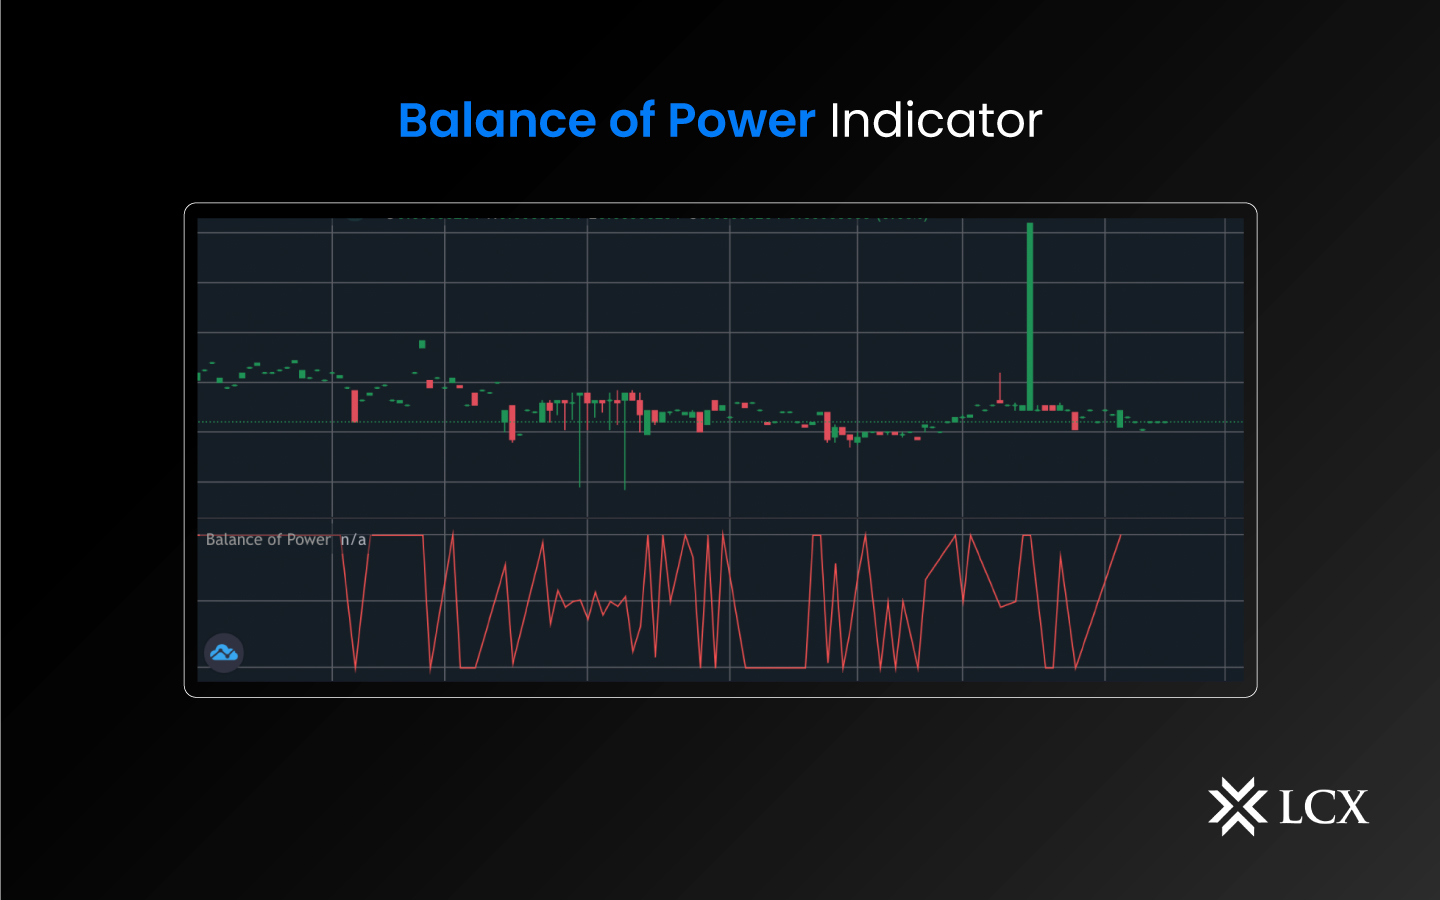
Cryptocurrency trading is a rapidly evolving market that requires traders to stay updated with the latest tools and strategies. Technical analysts use the Balance of Power (BOP), a price-based indicator, to gauge the overall strength of buyers and sellers in the market. It is based on the concept that price moves in trends, and the strength of these trends can be measured by the difference between the close and the open price. The BOP indicator uses this concept to determine the momentum of the market and provides traders with a visual representation of the balance between buyers and sellers. The Balance of Power (BOP) indicator is one such tool that has gained popularity among traders for its simplicity and effectiveness in determining market momentum.
Within the indicator, the positive values indicate bull market dominance, while the negative values indicate bear market dominance, as seen in the BOP oscillation around the zero line. BOP is not a particularly smooth indicator on its own, so it works best in combination with another indicator that can balance this by adding crucial smoothness. For instance, combining the BOP with the Simple Moving Average (SMA) yields a smooth, suitable analysis for viewing. This indicator is used to determine the strength of the buyers and sellers in the market and can be a valuable addition to any trader’s toolkit.
What is the history of the indicator?
The Balance of Power (BOP) indicator was developed by Igor Livshin and later introduced to the public in 2001 via Stocks and Commodities Magazine. BOP measures price trends by evaluating the strength of buyers and sellers within the market and determining which price is pushed to extreme highs and lows.

How to calculate the Balance of Power indicator?
To calculate the Balance of Power, use the following formula:
Balance of Power = (Close price – Open price) / (High price – Low price)
How does the indicator work?
The BOP indicator works by comparing the close price to the open price for each candle on a chart. If the close price is higher than the open price, it indicates that the buyers are in control and the market is bullish. On the other hand, if the close price is lower than the open price, it indicates that the sellers are in control and the market is bearish. The BOP indicator then plots this information as a histogram, with positive values indicating bullish momentum and negative values indicating bearish momentum.
The BOP indicator can be used to determine the momentum of the market and provide traders with valuable information about potential market trends. A high positive value on the BOP indicator indicates strong bullish momentum and suggests that traders should look for buying opportunities. On the other hand, a high negative value indicates a strong bearish momentum and suggests that traders should look for selling opportunities. The BOP indicator can also be used in conjunction with other technical indicators to confirm market trends and make more informed trading decisions.
In Conclusion
The Balance of Power indicator is a simple yet effective tool that can help traders determine the momentum of the market and make more informed trading decisions. While it should not be used as the sole basis for trading decisions, it can be a valuable addition to any trader’s toolkit when used in conjunction with other technical indicators. As with any trading tool, it is important to understand the underlying concepts and practice using the indicator in a demo account before incorporating it into a live trading strategy.