Brief Insight on How to Read Cryptocurrency Charts
by LCX Team ·
Cryptocurrency charts are an essential tool for anyone involved in the world of digital assets. Whether you’re a seasoned trader or just getting started in the crypto space, understanding how to read cryptocurrency charts is crucial for making informed decisions and maximizing your profits. In this comprehensive guide, we will break down the fundamentals of cryptocurrency charts, helping you decipher the intricate world of price movements, trends, and patterns.
Why Reading Cryptocurrency Charts Is Essential for Traders
Technical analysis can assist investors in identifying market trends and predicting the future price movements of an asset, so traders must read cryptocurrency charts in order to identify the best market opportunities.
Technical analysis is the process of analyzing statistical trends accumulated over time to determine how supply and demand influence the future price changes of a particular asset. Charts of the cryptocurrency market can help investors make informed decisions based on when they anticipate favorable and bearish trends to end.
A bullish movement is an upward price movement driven by bulls, who are the purchasers of an asset. A bearish movement is a downward price movement caused by the vendors of an asset, or bears. Technical analysis can assist traders in identifying trading opportunities by evaluating price trends and chart patterns. The finest cryptographic charts aid in monitoring market movements, but there are some limitations.
What Is Technical Analysis?
The term “technical” refers to the analysis of an asset’s past trading activity and price fluctuations, which, according to technical analysts, may be useful predictors of future price movements. It can be used for any asset with historical trading data, which implies stocks, futures, commodities, currencies, and cryptocurrencies.
Charles Dow, founder and publisher of the Wall Street Journal and co-founder of Dow Jones & Company, was the pioneer of technical analysis. Dow contributed to the development of the first stock index, namely the Dow Jones Transportation Index (DJT).
Dow’s concepts were published in a series of Wall Street Journal editorials, and after his death, they were compiled into what is now known as the Dow theory. Notably, through years of research, technical analysis has evolved to include the patterns and signals we recognize today.
The validity of technical analysis is contingent on whether the market has priced in all available information about a particular asset, implying that the asset is fairly valued based on this information. Traders who employ both technical analysis and market psychology believe that history will inevitably repeat itself.
Technical analysts may employ fundamental analysis in their trading strategy to determine if an asset is worth approaching, and they may supplement their decisions with analysis of trading signals to maximize profits. Fundamental analysis is the study of financial data affecting the price of an asset in order to forecast its future development. Fundamental analysis of a company’s stock may involve examining its earnings, industry performance, and brand value.
As technical analysts seek to identify bullish and bearish price movements in order to aid traders in making more informed decisions, they are tasked with identifying bullish and bearish price movements.
What is Dow Theory and the Six Tenets of Dow Theory?
In 1884, Charles Dow helped establish the first stock market index. The Dow Jones Industrial Average (DJIA) is a price-weighted index that tracks the 30 major publicly traded companies in the United States. It was created after this index. Dow believed that the stock market was a reliable indicator of economic business conditions and that, by analyzing it, significant market trends could be identified.
The contributions of several other analysts, including William Hamilton, Robert Thea, and Richard Russell, have altered Dow’s theory. Some aspects of Dow’s theory, including its emphasis on the transportation sector, have lost prominence over time. While traders continue to monitor the DJT, it is not considered a primary market index, as the DJIA is.
The theory has six major tenets, known as the six Dow theory tenets. Let’s examine them one by one in the sections that follow:
- The Market Reflects Everything
The first tenet of the Dow theory is one of the fundamental principles of technical analysis, which states that the market reflects all available information in asset prices and prices such information proportionately. For instance, if it is anticipated that a company will disclose positive earnings, the market will price the asset higher. The principle is similar to the Efficient Market Hypothesis (EMH), which states that asset prices reflect all available information and trade at their fair value on stock exchanges.
- There Are Three Kinds of Trends in the Market
Dow’s theory also suggests that there are three types of market trends. Primary trends are significant market movements that typically persist for months or years. Primary trends can be either a bull market or a negative market, in which the prices of assets increase or decrease over time, respectively.
There are secondary trends within these primary trends that may act against the primary trend. The secondary trends can be pullbacks in bull markets, where asset prices temporarily decline, or rallies in bear markets, where prices rise momentarily before resuming their downward trend.
There are also tertiary trends, which typically last a week or less and are often regarded as market noise that can be ignored because they do not affect long-term movements.
- Primary Trends Have Three Phases
Traders can discover opportunities by analyzing various trends. During a bullish primary trend, for instance, speculators can capitalize on a bearish secondary trend to purchase an asset at a lower price before it continues to rise. Recognizing these trends is challenging, particularly in light of the Dow theory, which states that primary trends have three phases.
The first phase, the accumulation phase for a bull market and the distribution phase for a bear market precedes a contrary trend and occurs when market sentiment is still predominantly negative in a bull market or positive during a bear market. During this phase, savvy traders recognize that a new trend is beginning and either accumulate in anticipation of an upward movement or distribute in anticipation of a downward movement.
The second phase is known as the public involvement phase. During this phase, the market as a whole recognizes that a new primary trend has begun and either begin purchasing additional assets to capitalize on upward price movements or begins selling to limit losses during downward price movements. In the second phase, prices swiftly increase or decrease.
During bull markets, the ultimate phase is known as the excess phase, and during bear markets, it is known as the panic phase. During the excess or hysteria phase, the general population continues to speculate as the trend approaches its conclusion. Those who comprehend this phase begin selling in anticipation of a bearish primary phase or purchasing in anticipation of a bullish primary phase.
|
Bull Market |
Bear Market |
|
|
Accumulation or distribution phase |
Marked by negative sentiments |
Marked by positive sentiments |
|
Public participation phase |
Wider market participants start buying |
Wider market participants start selling |
|
Excess/panic phase |
Thoughtful market participants anticipate a bearish trend and start selling |
Thoughtful market participants anticipate a bullish trend and start selling |
Although there is no assurance regarding the consistency of these trends, numerous investors take them into account before making decisions.
- Indices Must Correlate
According to the fourth tenet of Dow theory, a market trend is only confirmed when both indices indicate the beginning of a new trend. According to the theory, traders should not presume a new primary upward trend is commencing if one index confirms a new primary upward trend while another index remains in a primary downward trend.
At the time, the Dow’s primary indices were the Dow Jones Industrial Average and the Dow Jones Transportation Average, which would naturally tend to correlate given the close relationship between industrial activity and the transportation market.
- Volume Confirms Trends
According to the fifth tenet of Dow theory, trading volume should increase if the price of an asset is moving in the direction of its primary trend, and decrease if the price is moving in the opposite direction. Trading volume is a measure of how much an asset has been transacted over a given period and is regarded as a secondary indicator, with low volume indicating a weak trend and high volume indicating a strong trend.
If the market experiences a secondary bearish trend with low volume during a primary bullish trend, the secondary trend is relatively feeble. If the trading volume during the secondary trend is substantial, this indicates that more market participants are beginning to sell.
- Trends Are Valid Until a Reversal Is Clear
The sixth tenet of Dow theory suggests that trend reversals should be viewed with suspicion and caution, as primary trend reversals can easily be confounded with secondary trends.
What Are Candlestick Charts?
Traders have access to multiple types of indicators for examining and analyzing market trends in cryptocurrencies. As a result of the essence of candlesticks, crypto candlestick charts provide more data.
Synergies Between Blockchain and AI
Blockchain technology can enhance data integrity, enable secure data cooperation and sharing, facilitate tokenization and incentives, and support decentralized AI governance, thereby making AI systems more trustworthy and accessible.
Improved Data Accuracy
The inherent immutability and transparency of blockchain technology can enhance the data integrity of artificial intelligence systems. Blockchain technology enables artificial intelligence algorithms to access immutable and verifiable data, ensuring the accuracy and dependability of forecasts and insights. For example, supply chain management can use blockchain to monitor and record the movement of items. The data can then be analyzed by AI systems in order to identify patterns, detect anomalies, and enhance logistics procedures.
Secure Collaboration and Data Sharing
AI systems require access to diverse and massive data sets, and blockchain can provide a secure and decentralized data-sharing platform. Blockchain enables data sharing between multiple parties without relying on a single party, preserving data privacy and control. For instance, in the healthcare industry, blockchain-stored patient records can be securely shared with AI models for research or diagnosis without compromising the confidentiality of sensitive data.
Tokenization and Incentives
Blockchain technology can enable the creation of tokens or currencies that facilitate the incentives and monetization of AI environments. These tokens can be used to compensate individuals for providing computational resources, training models, or data. These incentives can encourage collaboration and participation in AI research and development.
Decentralized AI Governance
Blockchain technology can facilitate decentralized AI administration and decision-making processes. Fairness and transparency can be guaranteed through the use of smart contracts and decentralized autonomous organizations (DAOs) to ensure stakeholder participation in decision-making. This is notably useful in policy enforcement and the selection of AI models.
Future Prospects for Blockchain and AI Alliance
The relationship between blockchain and AI has tremendous future potential. As technology advances, one can anticipate further advancements in privacy-preserving machine learning algorithms, the growth of decentralized AI marketplaces, and increased accountability and transparency in AI systems.
When blockchain and AI are combined, there are also opportunities for enhanced explainability and auditability. Documenting the actions involved in AI model training and inference on the blockchain renders the decision-making process transparent and auditable. This can enhance the understanding of AI’s effects, facilitate regulatory compliance, and increase confidence in AI systems.
It is essential to recognize that there are obstacles and constraints to consider in the context of blockchain and AI. Blockchain technology is presently not scalable due to slower transaction speeds and greater energy consumption compared to conventional centralized systems. In addition, the computationally intensive nature of AI algorithms can make the deployment of these algorithms on blockchain networks challenging.
However, ongoing research and development in blockchain and AI are seeking solutions to these problems and optimizing their interaction. As technology continues to advance, one can anticipate the emergence of innovative solutions that use blockchain and AI to drive transformational change in a variety of industries.
Understanding Candlestick Charts
Similar to line and bar graphs, candlestick charts display time on the horizontal axis and private data on the vertical axis. The main difference is that candlesticks indicate whether the market’s price movement was positive or negative in a given period, and to what degree.
Different timeframes can be assigned to crypto market displays, with candlesticks representing each timeframe. For instance, if the timeframe of a crypto trading chart is set to four hours, each candlestick will represent four hours of trading activity. The trading period selected is contingent on a trader’s trading approach and method.
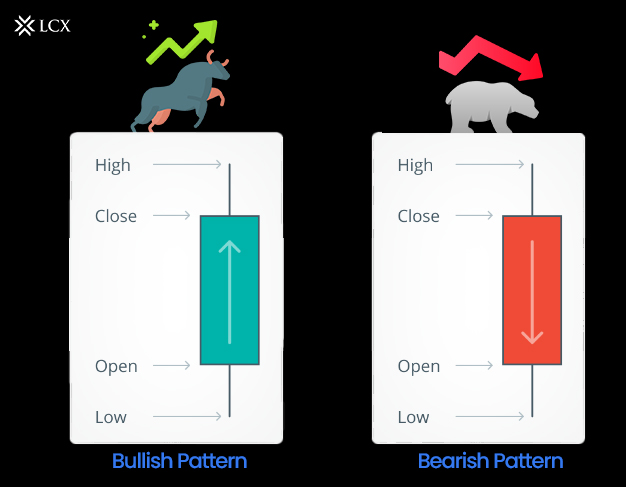
A candlestick consists primarily of a body and filaments. The body of each candlestick represents its opening and closing prices, while the upper wick represents how high the price of a cryptocurrency rose, and the bottom wick represents how low it fell during that time period.
In a similar fashion, candlesticks can be either green or red. Green candles indicate an increase in price over the period under consideration, while red candles indicate a decrease.
The straightforward structure of candlesticks provides users with a wealth of information. Technical analysts may use candlestick patterns to identify potential trend reversals, for instance. Traders of cryptocurrencies should be familiar with bullish and adverse candlestick patterns.
A long wick at the summit of a candle’s body, for instance, may indicate that traders are taking profits and that a sell-off is imminent. In contrast, a lengthy wick at the bottom may indicate that traders are purchasing the asset whenever its price declines.
Similarly, a candlestick in which the body occupies nearly all of the space and the wicks are extremely brief may indicate a strong bullish or bearish sentiment, depending on its color. A candlestick with almost nobody and lengthy wicks, on the other hand, indicates that neither buyers nor sellers are in control.
Support and Resistance Levels
Using support and resistance levels, which can be identified using trendlines, makes it simpler to interpret live crypto candlestick charts. On graphs, trendlines are drawn by connecting a series of prices.
Support levels are price points during pullbacks where a concentration of purchasing interest is expected to halt cryptocurrencies or any other asset. Resistance levels are price points where selling pressure is concentrated. Concentrated purchasing and selling interests make it difficult to surpass these thresholds.
Trendlines can be used to identify support and resistance levels, as they facilitate the identification of crypto chart patterns. Using the cryptocurrency’s lowest and second-lowest lows in a given timeframe, an uptrend line is drawn. The levels that graze this trendline are considered support.
Using the cryptocurrency’s highest and second-highest highs, a downtrend line is drawn; levels touching this line are considered resistance levels. Downtrend lines are utilized during downtrends, whereas uptrend lines are utilized during uptrends. Depending on trendlines and support and resistance levels, various trading strategies can be employed. Some technical analysts, for instance, merely purchase near the support of uptrend lines and sell near the resistance of downtrend lines.
Frequently, the price of a cryptocurrency may fluctuate within a relatively stable range. Bitcoin BTC, for example, traded between $6,000 and $6,500 between September and November 2018 before falling to $3,200 by December 2018. In this instance, resistance levels are located at the top of the spectrum, whereas support levels are located at the bottom. A breakdown may occur if the price of the cryptocurrency descends below the range with a significant price movement, and a breakout may occur if the price moves above the range with a significant price movement.
Using long-term moving averages, support, and resistance levels can also be determined. These are typical technical indicators that normalize price data by calculating a continuously updated price average.
What are Top Three Advanced Chart Analysis?
- Moving Averages
Moving averages smooth out price data by calculating the average price over a specified number of periods. Common moving averages include the Simple Moving Average (SMA) and the Exponential Moving Average (EMA). They help identify trends and potential reversal points.
- Relative Strength Index (RSI)
The RSI is a momentum oscillator that measures the speed and change of price movements. It ranges from 0 to 100 and is used to identify overbought (above 70) and oversold (below 30) conditions.
- Bollinger Bands
Bollinger Bands consist of three lines: the middle band (SMA), an upper band (SMA + standard deviation), and a lower band (SMA – standard deviation). They help traders gauge volatility and potential price reversals.
Conclusion
Understanding how to read cryptocurrency charts is a foundational skill for anyone interested in the world of digital assets. By mastering the basics of chart analysis, recognizing key components, and applying advanced techniques, you can make more informed trading decisions and increase your chances of success in the crypto market. Remember that cryptocurrency trading carries risks, so always use proper risk management and never invest more than you can afford to lose.