How to Use Tradingview on LCX Exchange
by LCX Team ·
Introduction
TradingView is a powerful tool that can be used by cryptocurrency traders to analyze the possibilities of their investments. The platform allows users to create charts, analyze real-time data and perform technical analysis. Here are some ways you can use TradingView for your cryptocurrency trading:
- Create Charts and Analyses
- Follow Market Trends
- Connect and share strategies with other traders
- Do Technical Analysis Research
You may be wondering what kind of information traders can find in these charts. For example, if you want to track how much money each coin has made in value over time or see what percent their price has changed from yesterday’s close price – TradingView has tons of features designed specifically for this purpose! So now let’s dive into tradingVew’s features and steps on using TradingView during our own cryptocurrency trading journey on LCX Exchange.
What is TradingView
TradingView is a charting and technical analysis platform that allows you to create and share technical analysis charts and follow other traders’ charts. TradingView is used by more than 30 million traders and investors worldwide to spot opportunities across global markets.
TradingView is the most powerful charting platform for traders enabling them to not only use charts but also to create and test their own self-written strategies. It provides users with access to real-time data from over 100 exchanges and 20+ financial instruments, as well as advanced charting tools that enable them to create, share and collaborate on technical analysis charts.
TradingView features
- Social Network of Traders: TradingView is a social networking platform for traders.
- Detailed Charts: It offers detailed charts, which can help you visualize your strategy in real-time and make adjustments accordingly.
- Trading Strategies: You can create your own trading ideas, strategies and indicators using the tools available on TradingView.
- Technical Analysis: The platform also has a wide range of technical analysis tools that enable users to analyze crypto markets effectively.
How to use TradingView charts on Cryptocurrency exchange?
LCX Exchange is one of the few exchanges that offer integrated TradingView charts for its users. The integrated TradingView charts help traders stimulate trading on the chart. LCX’s in-depth integration with TradingView helps traders upgrade their trading experience and elevate profits with fast charts, advanced indicators, & more.
To use TradingView charts on the LCX exchange, you need to create an account on the LCX exchange. Then, login into your account and go to the exchange or trading page.
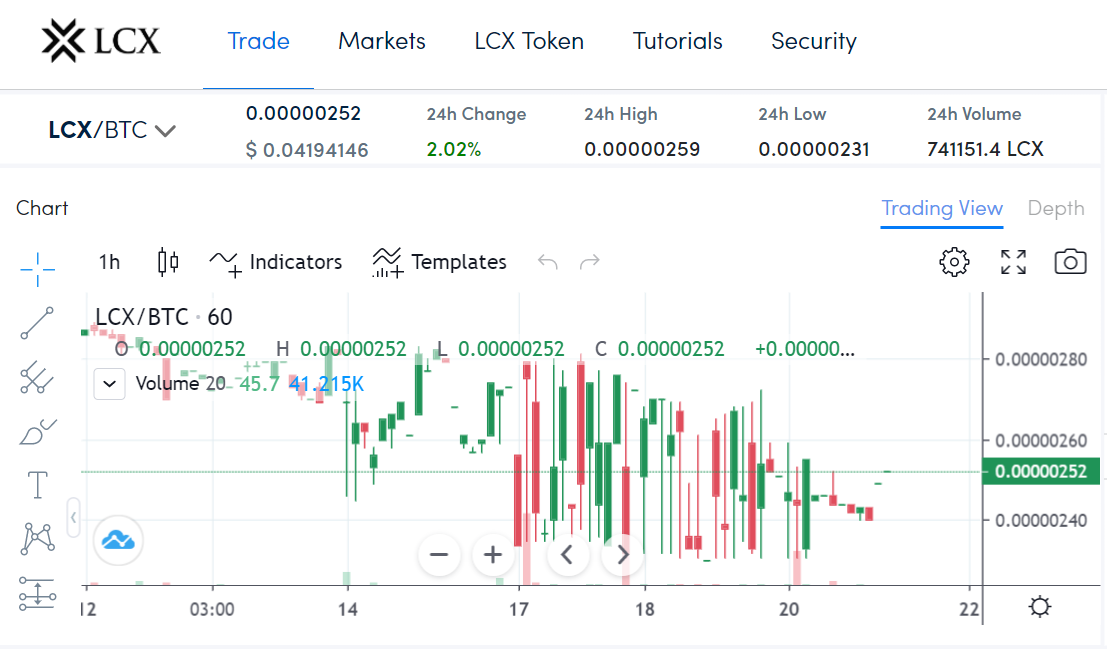
Search for a cryptocurrency and trading pair that you want to analyze. Access the TradingView Chart in the left section of your screen under “Chart”. Set Chart Timeframe– select your preferred time frame for plotting data points such as candles or candlesticks etcetera; choose between minutes (default), hours and days depending upon how much time you have available during trading sessions but may be changed later if needed.
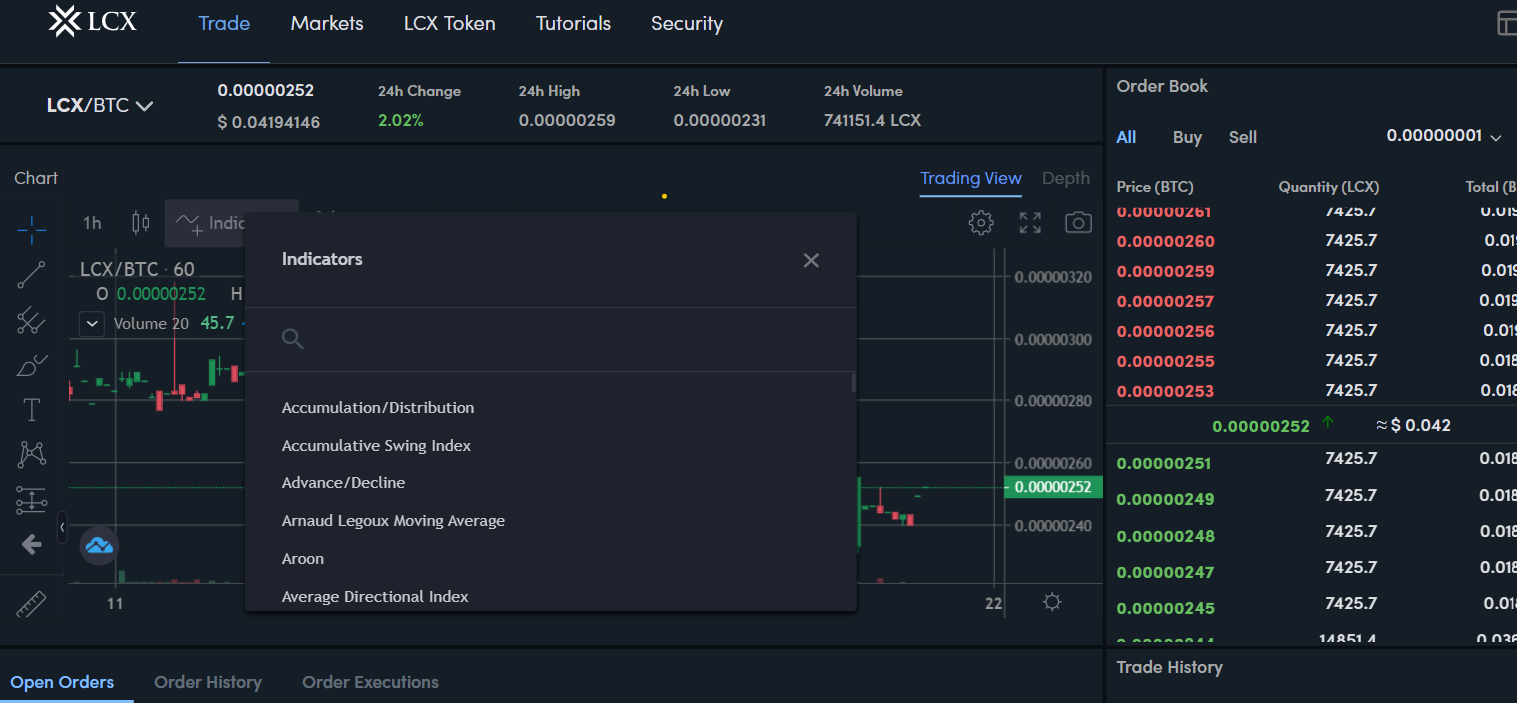
There are a variety of indicators available, you can select your preferred indicator by clicking on the indicators option, and a drop-down list will appear where you can search and select according to your trading preference. You can select popular trading indicators such as Bollinger Bands, RSi, MACD and more.
Read our detailed guide on Bollinger Bands indicators to know more about it.
Closing Thoughts
We hope that this article helped you understand how to use TradingView and cryptocurrency charts. Please feel free to reach our customer support section if there’s anything else we can do for you!