Hammer Candlestick Used in Crypto Technical Analysis Explained
by LCX Team ·
Candlestick charts are a charting tool used for tracking the movement of a crypto asset. Over the last few decades, candlestick charts have become a popular tool with traders because they’re easy to read. Let’s find out what a hammer candlestick is and how you can use it in trading.
You’ve probably seen candlestick charts before, but you may not know what they are or how they work. A candlestick chart shows two moving averages: one on top and one on the bottom. The upper moving average represents an open price while the lower moving average represents an equal-length period ago (EPL). Each day’s data is represented by a small box at the end of each candlestick line; this box contains important information about your trading strategy such as whether you’re long or short on Bitcoin (BTC).
What is a hammer candlestick?
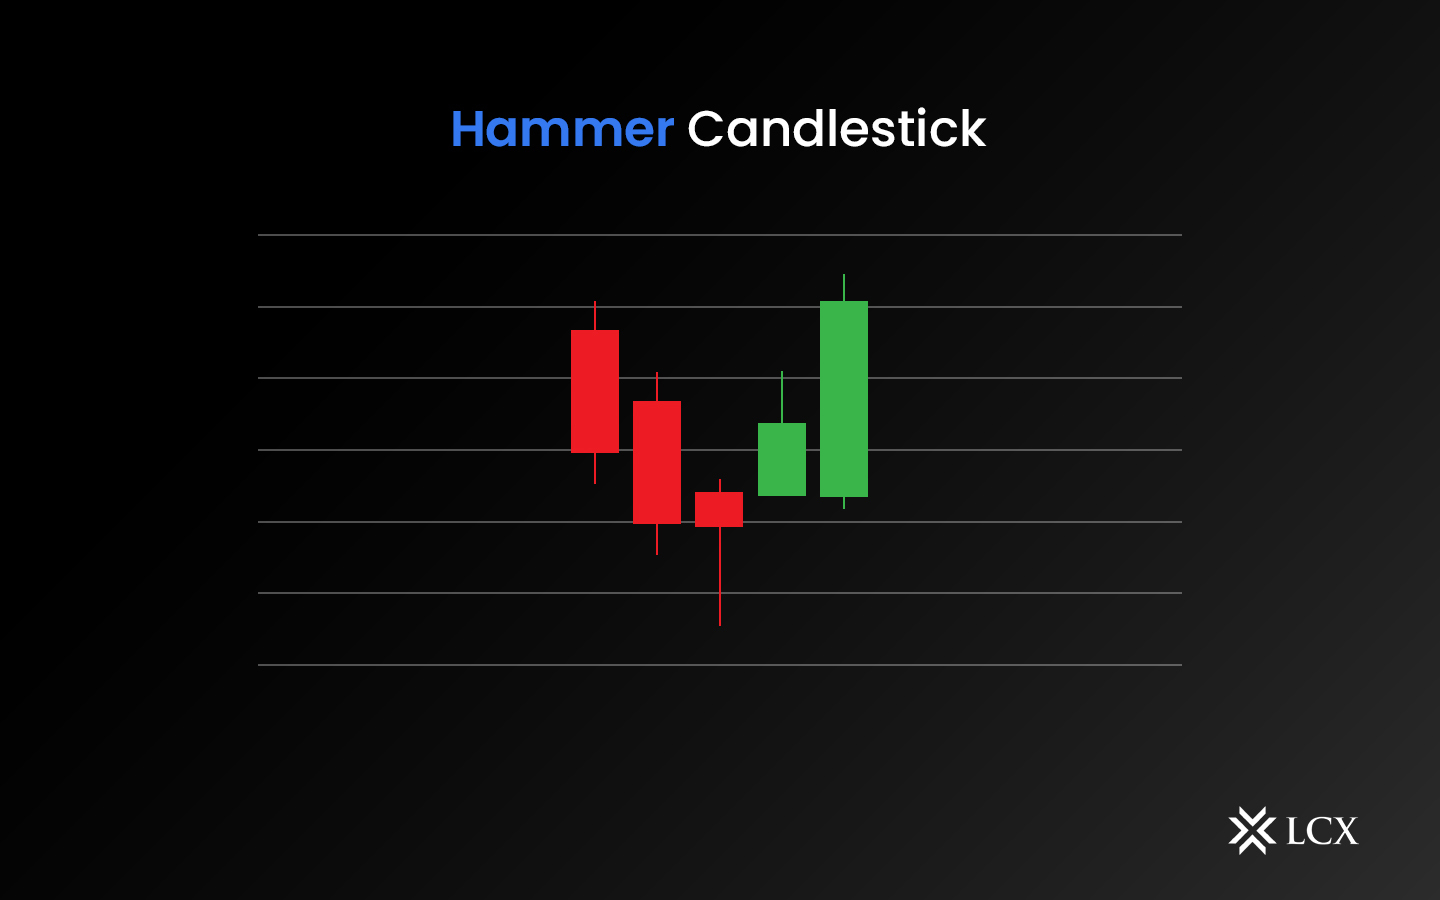
A hammer candlestick is a trend reversal pattern spotted at the bottom of a downtrend. The pattern looks like a hammer, with a long lower shadow and a small body hence named as a hammer candlestick. This pattern is characterized by a long lower shadow. It shows that sellers exerted considerable pressure during the session, but that buyers stepped in at the end and pushed prices upwards again. This is a very bullish sign and suggests that the downtrend may be coming to an end.
If you see a hammer candlestick on a chart, it’s important to confirm the trend reversal by looking for other bullish indicators. For example, you might look for a move above the candlestick high, or for the next candlestick to be bullish. Once you confirm the reversal, you can enter a long position.
Inverted Hammer Pattern
An inverted hammer occurs when an upward trend meets its first low point, then reverses back down again with increased momentum before finally breaking through this resistance level and continuing higher toward another peak.
Hanging Man Hammer Pattern
Hanging man candlesticks are a bearish reversal pattern that forms when the market opens higher than it closes. The long wick on the candlestick indicates that there was notable selling pressure during the day, suggesting a continuous fall in the market.
Shooting Star Hammer Pattern
The inverted hammer candlestick that points downwards is known as a shooting star. It indicates a possible reversal, but a bearish reversal. The shooting star is essentially an inverted hammer formed after an uptrend, occurring if the open price exceeds the close and the wick indicates a downward movement.
How to use hammer candlestick patterns in trading?
Hammer candlesticks are a great way to determine the direction of a trend. They can also be used to predict future market movements by looking at how they form and their shape and body.
Bullish hammer patterns indicate that prices will continue moving up while bearish ones mean they are likely to fall. The best time to enter trades based on these patterns is when there has been an increase in volume across markets or when there has been a significant change in price action over a short period (usually less than one day).
Conclusion
Candlestick charts are a great tool for technical analysis. They can help traders anticipate price moves and make better trading decisions. In this article, we’ve explained the hammer candlestick pattern, which is one of the most popular ones in crypto trading. LCX exchange offers advanced charting where you can use various trading technical indicators and patterns to ascertain your next move.